This document is a guide to using the GridGuard dashboard, it contains both what features are available from the GridGuard platform and how to use them.
¶ Installation Guide
Installation contains the bidding and operation for each installation.
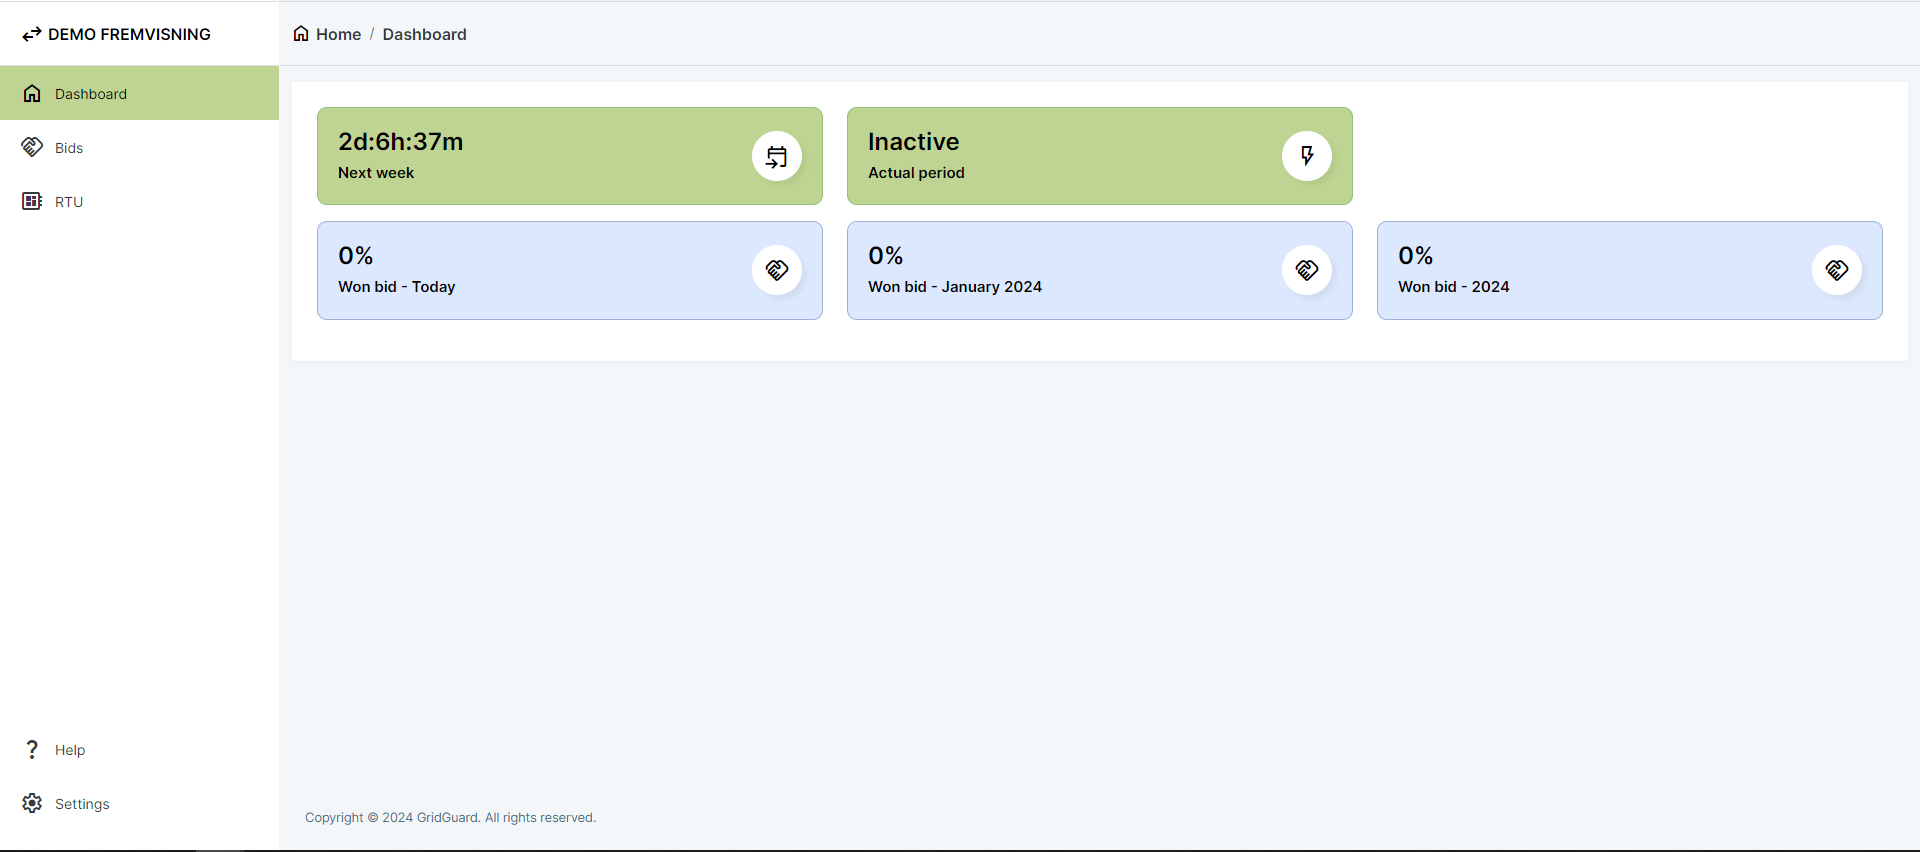
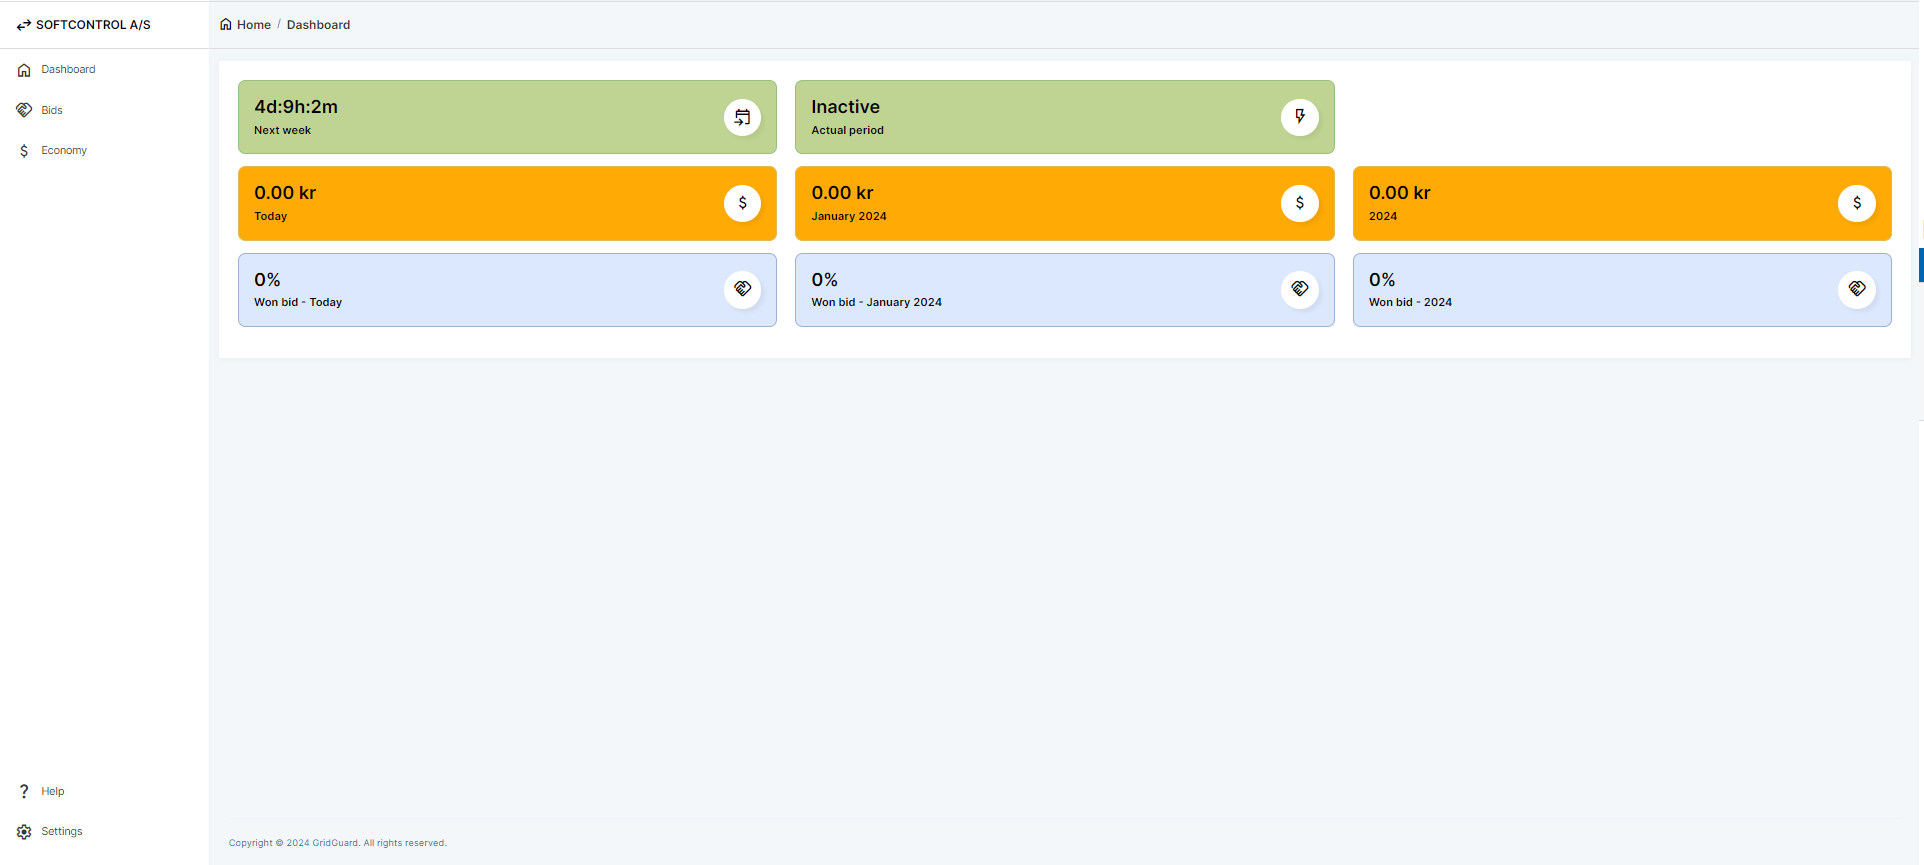
¶ Dashboard
After both operator and installation are selected, the Dashboard appears. From here it is possible to see when the current bidding round closes and if there is an active bid running. In addition, an overview of won bids is visible for the current day, month and year.
¶ Bids
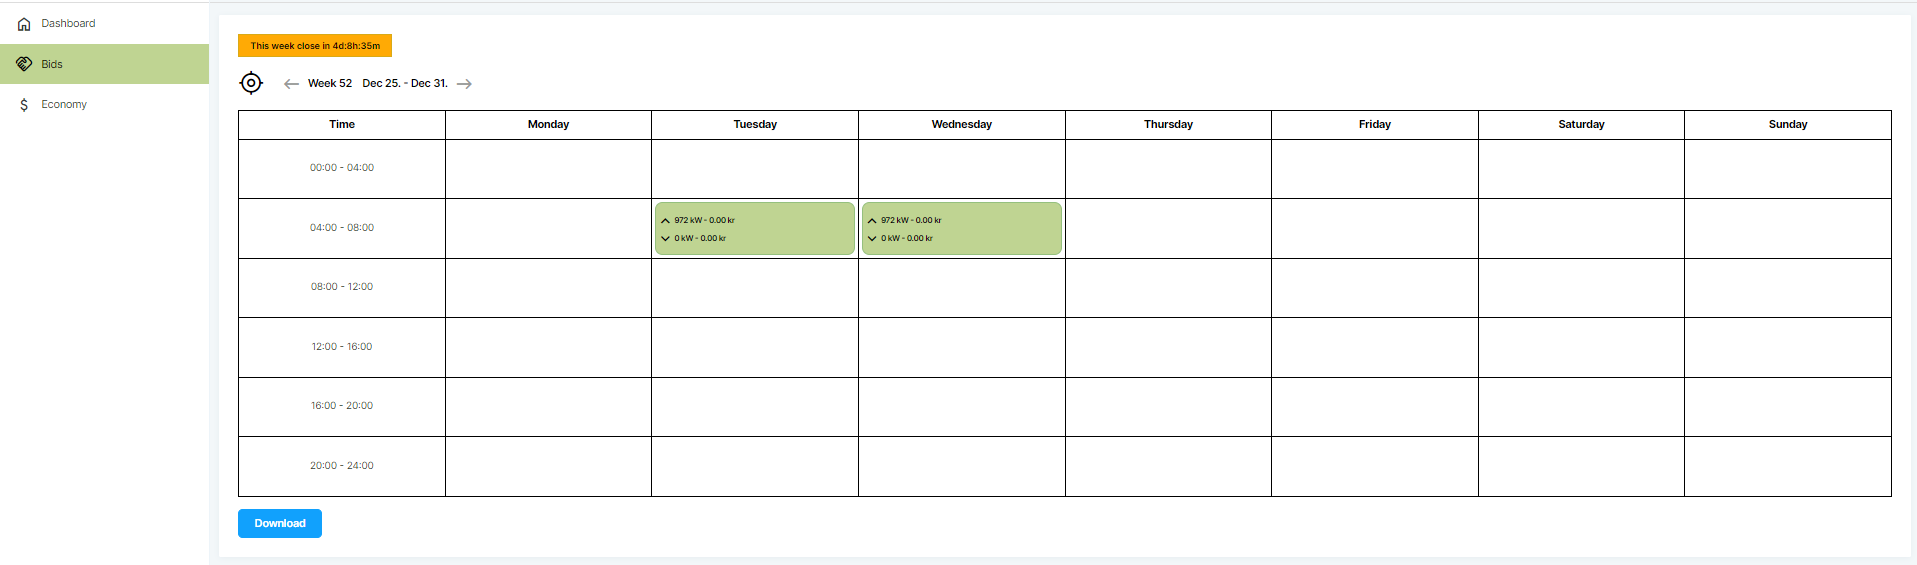
Under Bids is a calendar with both active and old bids. The periods are color-coded according to the status of the bid:
- Green: The bid has been placed and the market is still open.
- Yellow: The market is closed and the bid has won.
- Gray: The market is closed and the bid is lost.
- Red: The market is closed and the result has not been received yet.
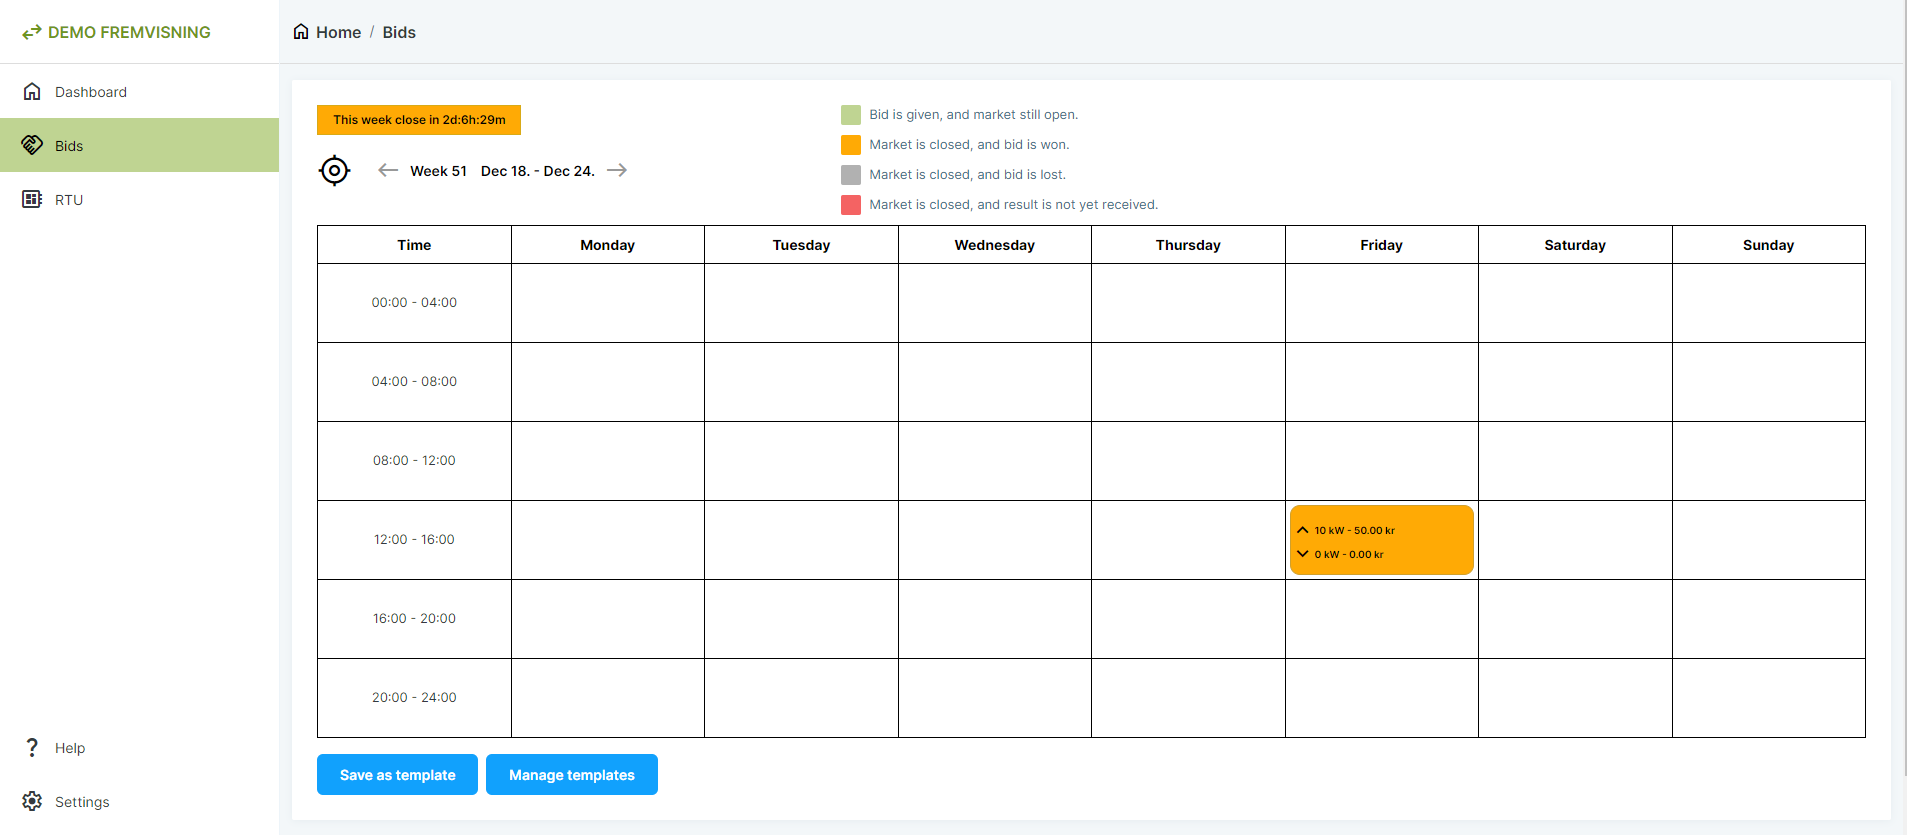
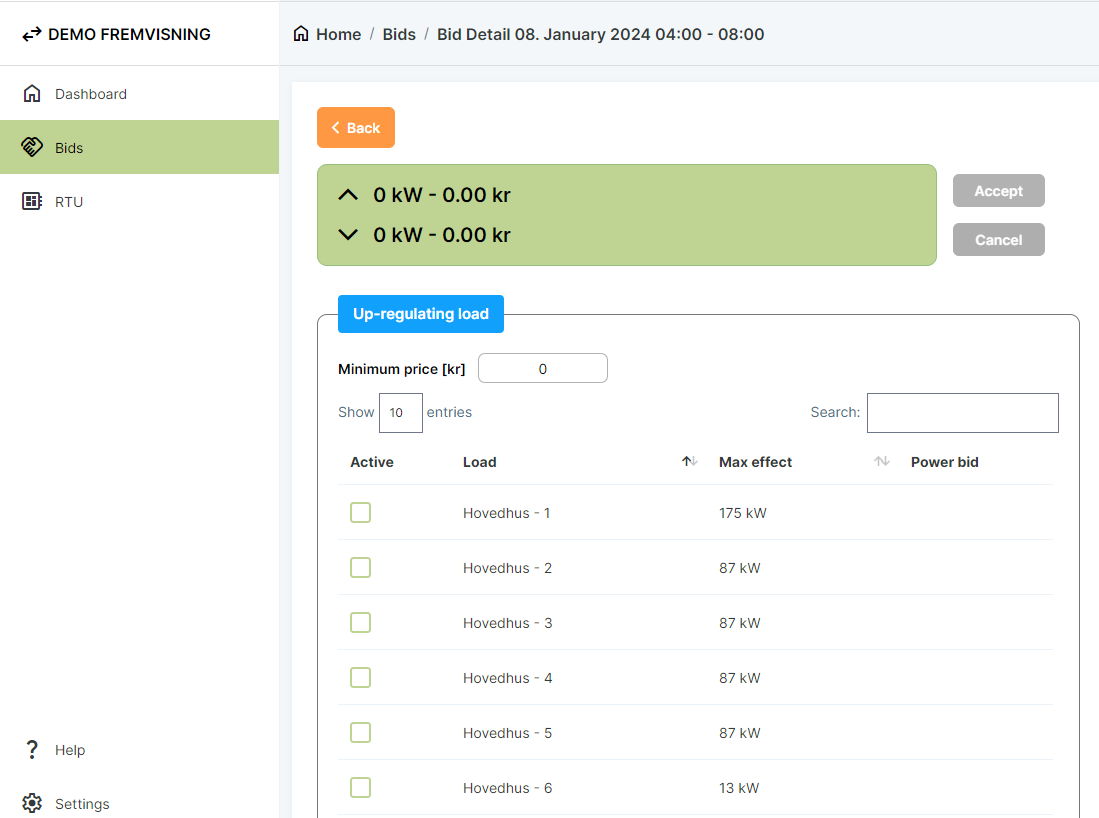
To create a new bid, double-click on an empty period. The following window will appear.
Here, the bid price and maximum power can be selected based on the existing loads.
In addition, it is possible to save templates of used bids by using 'Save as template', so they can easily be reused.
¶ RTU
The RTU window shows the current operation of the installation. Here the frequency and power can be read and the controller's operating point can be seen on the graph. The power is how much load is being taken off the installation.
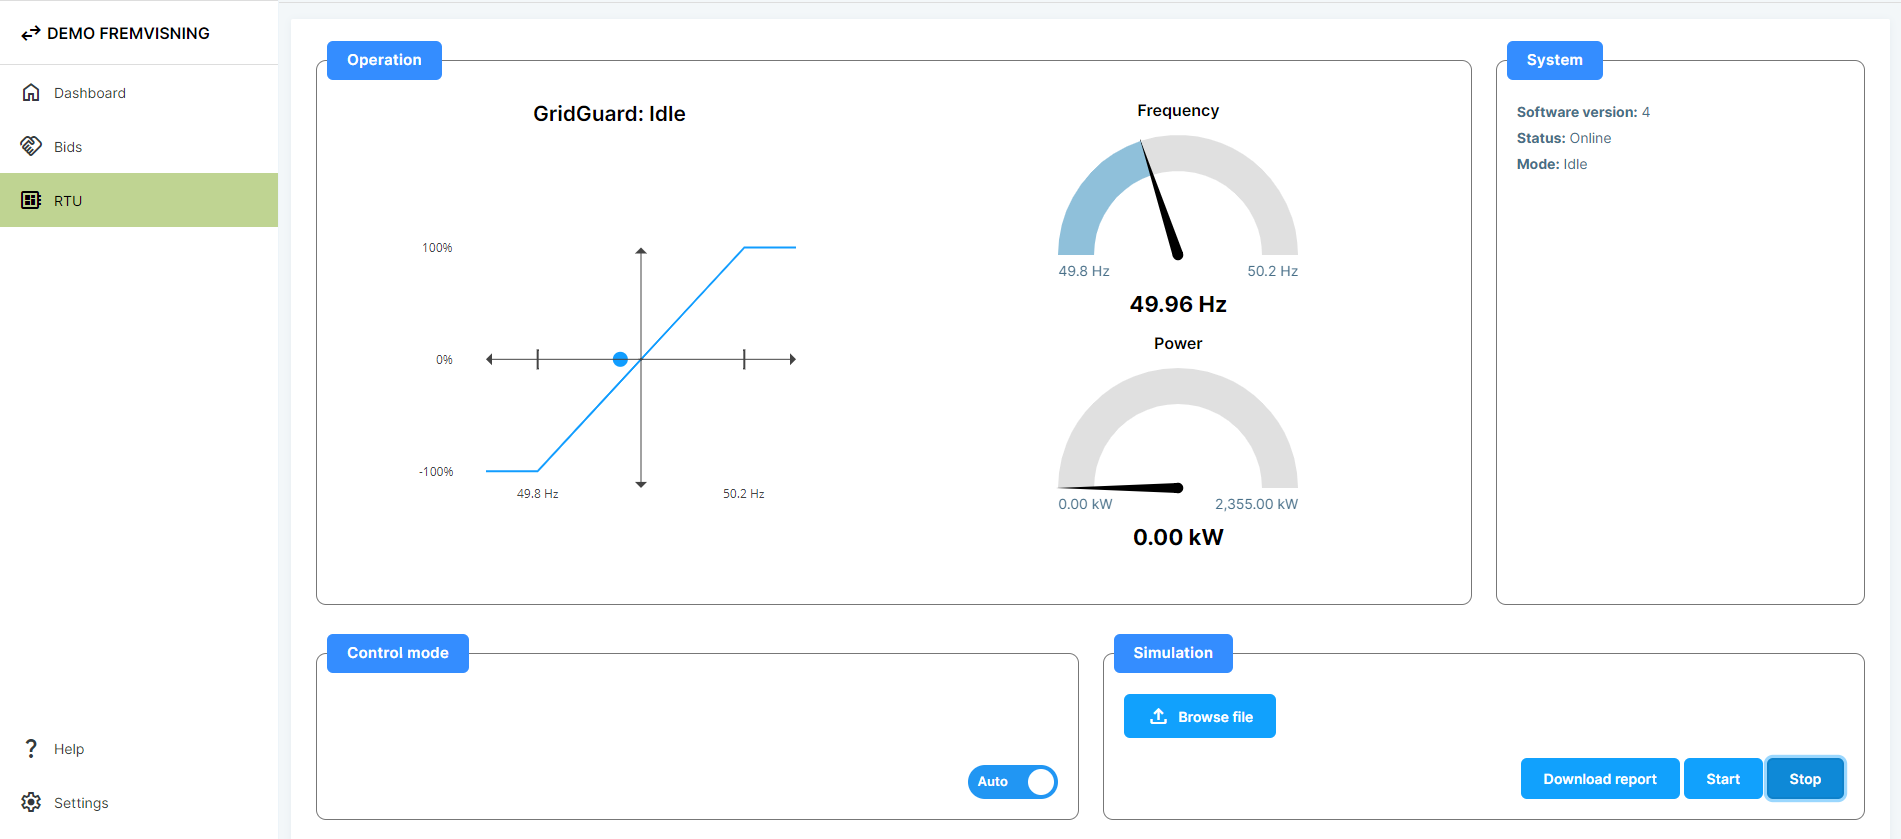
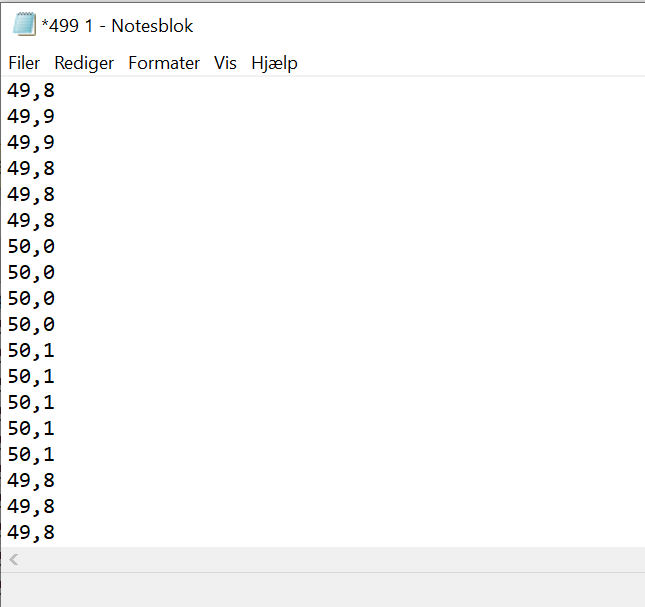
The simulation window makes it possible to test the installation's reaction to a given frequency change. The simulation needs a CSV file with a frequency value per line (see example to the right).
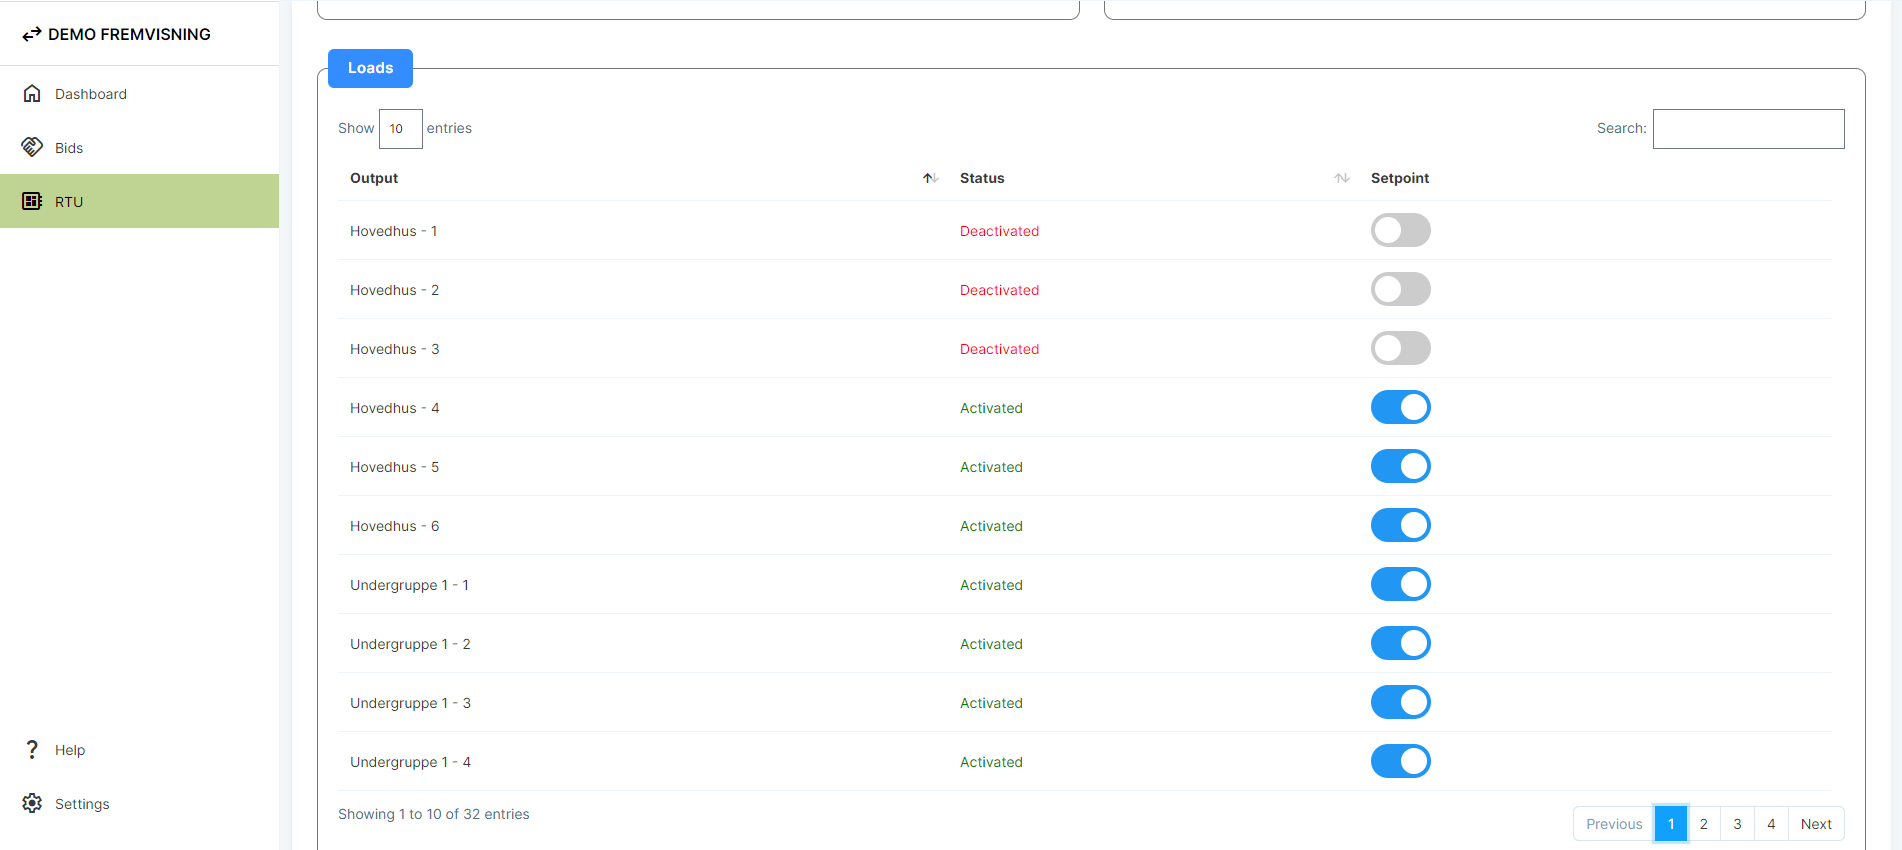
From the loads list, you can select/deselect which loads to include. The download report provides a report of the power response at the given frequencies.
¶ Operatør
Under operator is a summary of all the operator's installations
¶ Dashboard
Under Dashboard you can see when the current bidding round closes and if there is an active bid running. In addition, an overview of winning bids is visible for the current day, month and year. In addition, there is an overview of where some of the submitted bids have been won.
¶ Bids
Under Bids is a calendar with both active and old bids. The periods are color-coded according to the status of the bid:
- Green: The bid has been placed and the market is still open.
- Yellow: The market is closed and the bid has been won.
- Gray: The market is closed and the bid is lost.
- Red: The market is closed and the result has not been received yet.
- Blue: Multiple bids with different status.
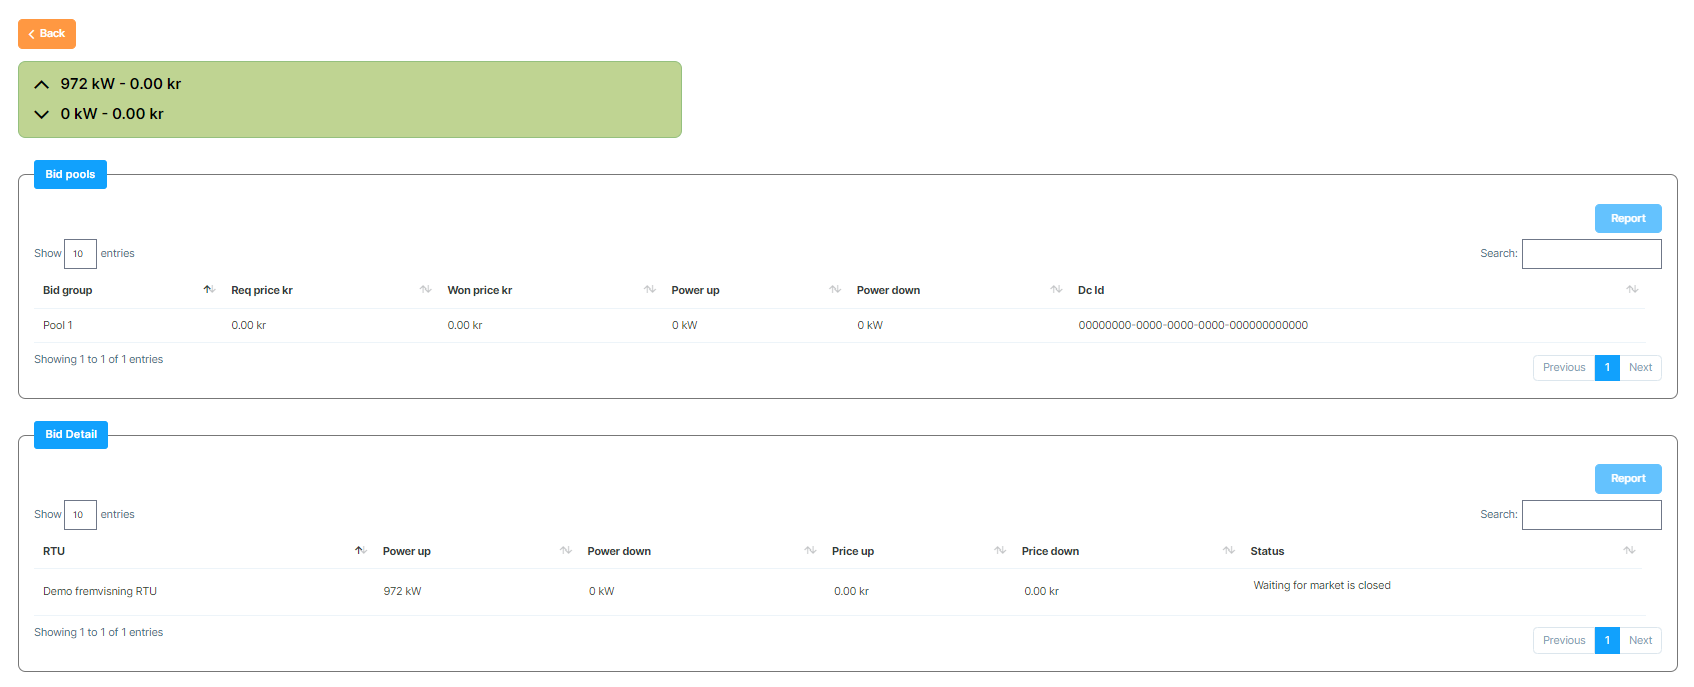
Double-clicking on a bid opens an overview of which installations are included in the bid and what the bid is for. The Report button at Bid pools generates a report that can be used as documentation for Energinet, it contains time, power and frequency. It is only possible to download a report after a row has been selected.
Dc Id is the reference ID for Danske Commodities.
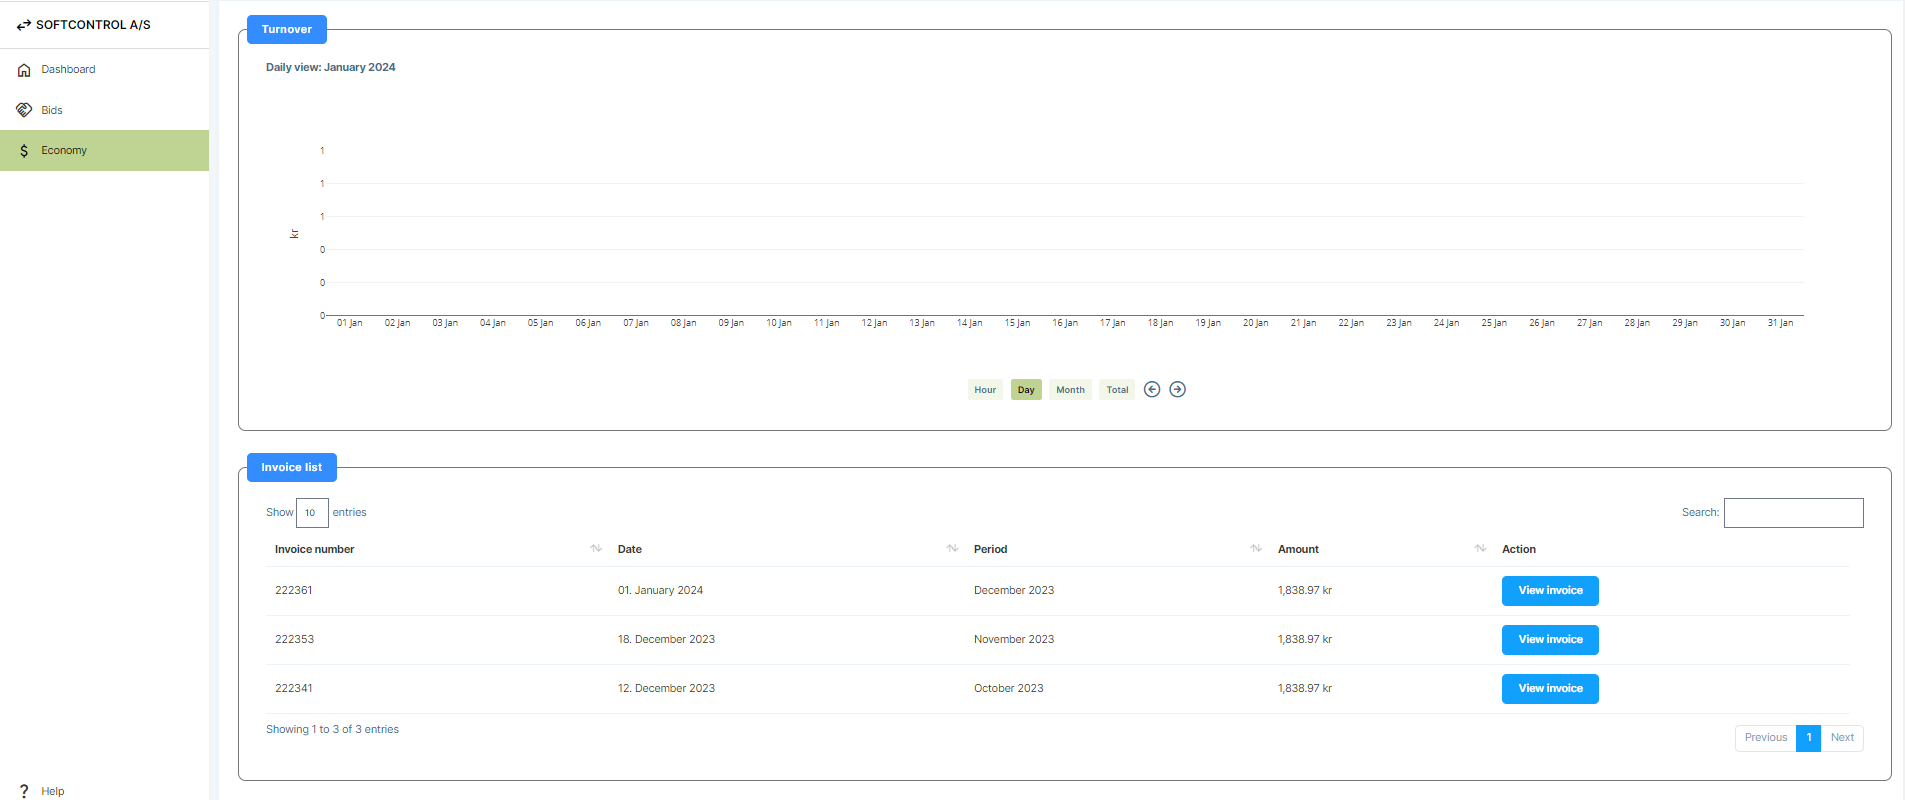
¶ Economy
Under Economy, the monthly invoices can be retrieved. In addition, the turnover is shown graphically.
The invoice for a given month can be accessed in PDF format by clicking "View Invoice".